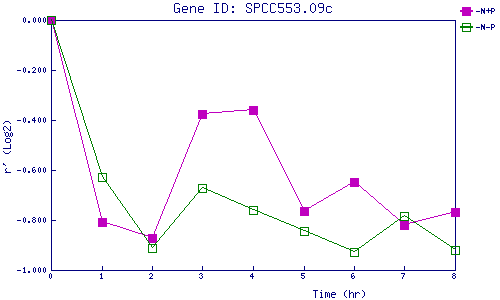
| 0 | 1 | 2 | 3 | 4 | 5 | 6 | 7 | 8 | |
| -N+P | 0.000 | -0.810 | -0.874 | -0.375 | -0.360 | -0.765 | -0.650 | -0.821 | -0.770 |
| -N-P | 0.000 | -0.628 | -0.912 | -0.670 | -0.762 | -0.845 | -0.928 | -0.785 | -0.920 |
|
-N+P: Nitrogen starved in the presence of P-factor -N-P: Nitrogen starved in the absence of P-factor |