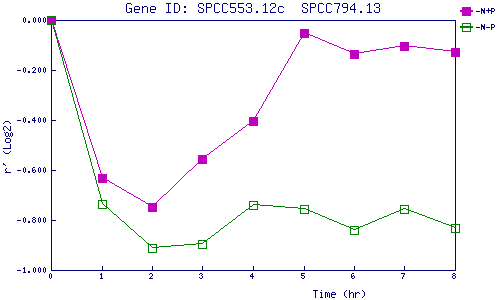
| 0 | 1 | 2 | 3 | 4 | 5 | 6 | 7 | 8 | |
| -N+P | 0.000 | -0.630 | -0.749 | -0.555 | -0.405 | -0.052 | -0.138 | -0.106 | -0.127 |
| -N-P | 0.000 | -0.737 | -0.913 | -0.895 | -0.739 | -0.755 | -0.840 | -0.757 | -0.834 |
|
-N+P: Nitrogen starved in the presence of P-factor -N-P: Nitrogen starved in the absence of P-factor |