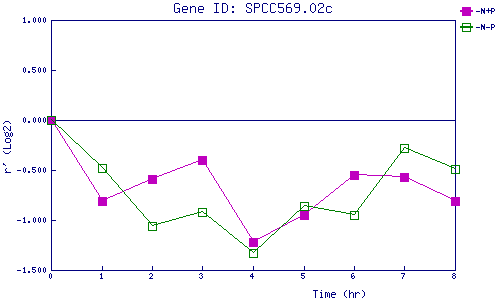
| 0 | 1 | 2 | 3 | 4 | 5 | 6 | 7 | 8 | |
| -N+P | 0.000 | -0.809 | -0.590 | -0.403 | -1.218 | -0.948 | -0.554 | -0.568 | -0.813 |
| -N-P | 0.000 | -0.485 | -1.061 | -0.917 | -1.329 | -0.864 | -0.954 | -0.280 | -0.494 |
|
-N+P: Nitrogen starved in the presence of P-factor -N-P: Nitrogen starved in the absence of P-factor |