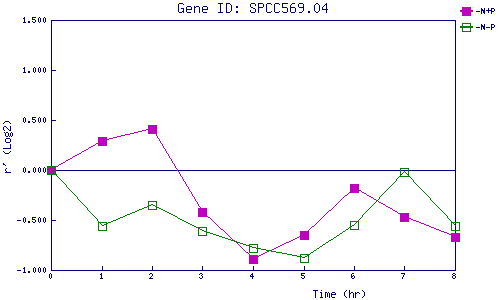
| 0 | 1 | 2 | 3 | 4 | 5 | 6 | 7 | 8 | |
| -N+P | 0.000 | 0.287 | 0.406 | -0.415 | -0.890 | -0.651 | -0.176 | -0.473 | -0.669 |
| -N-P | 0.000 | -0.563 | -0.351 | -0.606 | -0.785 | -0.878 | -0.546 | -0.021 | -0.559 |
|
-N+P: Nitrogen starved in the presence of P-factor -N-P: Nitrogen starved in the absence of P-factor |