ret3
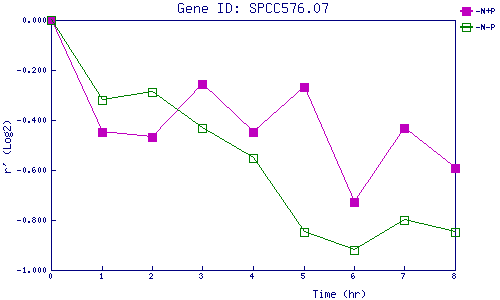
| 0 | 1 | 2 | 3 | 4 | 5 | 6 | 7 | 8 | |
| -N+P | 0.000 | -0.448 | -0.469 | -0.257 | -0.447 | -0.267 | -0.730 | -0.433 | -0.594 |
| -N-P | 0.000 | -0.322 | -0.286 | -0.431 | -0.552 | -0.846 | -0.918 | -0.802 | -0.848 |
|
-N+P: Nitrogen starved in the presence of P-factor -N-P: Nitrogen starved in the absence of P-factor |