rps2
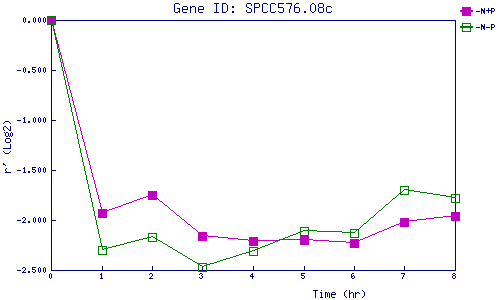
| 0 | 1 | 2 | 3 | 4 | 5 | 6 | 7 | 8 | |
| -N+P | 0.000 | -1.934 | -1.751 | -2.159 | -2.209 | -2.197 | -2.232 | -2.020 | -1.959 |
| -N-P | 0.000 | -2.305 | -2.167 | -2.471 | -2.310 | -2.113 | -2.127 | -1.697 | -1.784 |
|
-N+P: Nitrogen starved in the presence of P-factor -N-P: Nitrogen starved in the absence of P-factor |