rps20
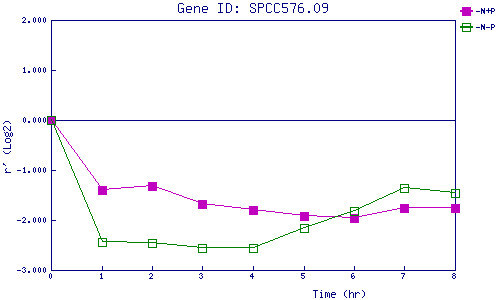
| 0 | 1 | 2 | 3 | 4 | 5 | 6 | 7 | 8 | |
| -N+P | 0.000 | -1.391 | -1.314 | -1.688 | -1.802 | -1.922 | -1.959 | -1.770 | -1.756 |
| -N-P | 0.000 | -2.440 | -2.458 | -2.554 | -2.557 | -2.156 | -1.829 | -1.356 | -1.469 |
|
-N+P: Nitrogen starved in the presence of P-factor -N-P: Nitrogen starved in the absence of P-factor |