rpl15
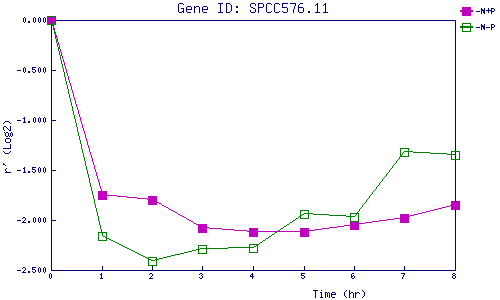
| 0 | 1 | 2 | 3 | 4 | 5 | 6 | 7 | 8 | |
| -N+P | 0.000 | -1.750 | -1.802 | -2.076 | -2.125 | -2.118 | -2.050 | -1.983 | -1.846 |
| -N-P | 0.000 | -2.156 | -2.413 | -2.290 | -2.277 | -1.942 | -1.970 | -1.323 | -1.353 |
|
-N+P: Nitrogen starved in the presence of P-factor -N-P: Nitrogen starved in the absence of P-factor |