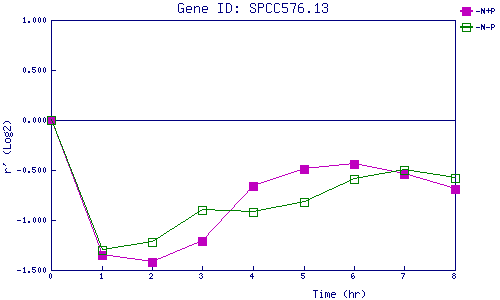
| 0 | 1 | 2 | 3 | 4 | 5 | 6 | 7 | 8 | |
| -N+P | 0.000 | -1.346 | -1.425 | -1.207 | -0.663 | -0.493 | -0.442 | -0.537 | -0.691 |
| -N-P | 0.000 | -1.297 | -1.223 | -0.900 | -0.925 | -0.816 | -0.592 | -0.499 | -0.579 |
|
-N+P: Nitrogen starved in the presence of P-factor -N-P: Nitrogen starved in the absence of P-factor |