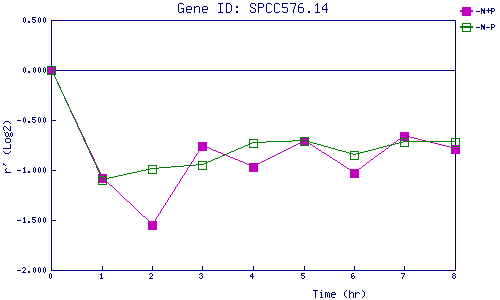
| 0 | 1 | 2 | 3 | 4 | 5 | 6 | 7 | 8 | |
| -N+P | 0.000 | -1.083 | -1.552 | -0.765 | -0.969 | -0.713 | -1.032 | -0.662 | -0.788 |
| -N-P | 0.000 | -1.104 | -0.987 | -0.953 | -0.728 | -0.706 | -0.853 | -0.723 | -0.717 |
|
-N+P: Nitrogen starved in the presence of P-factor -N-P: Nitrogen starved in the absence of P-factor |