ksg1
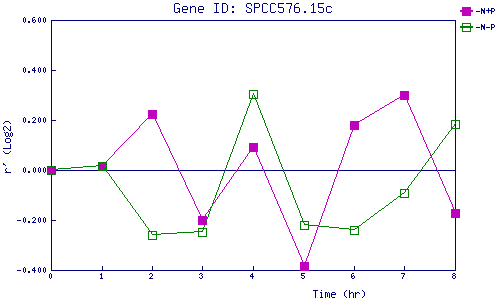
| 0 | 1 | 2 | 3 | 4 | 5 | 6 | 7 | 8 | |
| -N+P | 0.000 | 0.015 | 0.224 | -0.198 | 0.092 | -0.385 | 0.181 | 0.300 | -0.171 |
| -N-P | 0.000 | 0.014 | -0.259 | -0.248 | 0.306 | -0.219 | -0.241 | -0.091 | 0.184 |
|
-N+P: Nitrogen starved in the presence of P-factor -N-P: Nitrogen starved in the absence of P-factor |