wtf8-pseudo wtf22
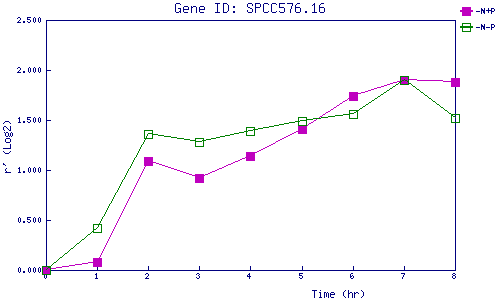
| 0 | 1 | 2 | 3 | 4 | 5 | 6 | 7 | 8 | |
| -N+P | 0.000 | 0.080 | 1.092 | 0.924 | 1.137 | 1.413 | 1.737 | 1.899 | 1.883 |
| -N-P | 0.000 | 0.419 | 1.361 | 1.285 | 1.393 | 1.492 | 1.564 | 1.901 | 1.516 |
|
-N+P: Nitrogen starved in the presence of P-factor -N-P: Nitrogen starved in the absence of P-factor |