| 0 | 1 | 2 | 3 | 4 | 5 | 6 | 7 | 8 | |
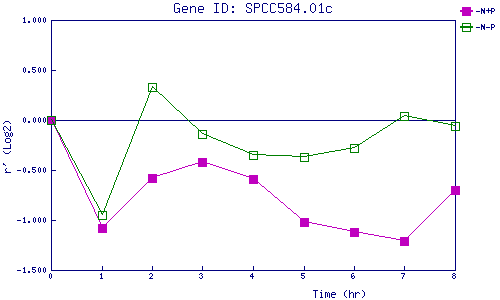
| -N+P | 0.000 | -1.084 | -0.577 | -0.420 | -0.592 | -1.019 | -1.125 | -1.206 | -0.705 |
| -N-P | 0.000 | -0.953 | 0.326 | -0.145 | -0.346 | -0.368 | -0.278 | 0.036 | -0.059 |
|
-N+P: Nitrogen starved in the presence of P-factor -N-P: Nitrogen starved in the absence of P-factor |