sup35 eRF3
| 0 | 1 | 2 | 3 | 4 | 5 | 6 | 7 | 8 | |
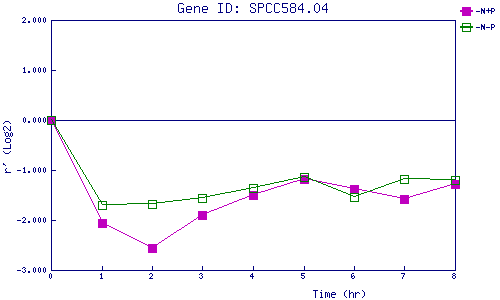
| -N+P | 0.000 | -2.056 | -2.556 | -1.893 | -1.509 | -1.185 | -1.379 | -1.574 | -1.277 |
| -N-P | 0.000 | -1.698 | -1.682 | -1.566 | -1.364 | -1.131 | -1.535 | -1.182 | -1.202 |
|
-N+P: Nitrogen starved in the presence of P-factor -N-P: Nitrogen starved in the absence of P-factor |
