sec1
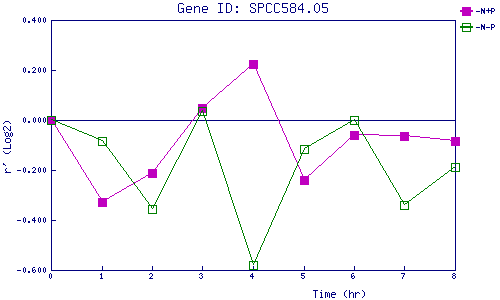
| 0 | 1 | 2 | 3 | 4 | 5 | 6 | 7 | 8 | |
| -N+P | 0.000 | -0.327 | -0.213 | 0.049 | 0.226 | -0.240 | -0.061 | -0.064 | -0.083 |
| -N-P | 0.000 | -0.083 | -0.356 | 0.035 | -0.580 | -0.116 | 0.000 | -0.339 | -0.188 |
|
-N+P: Nitrogen starved in the presence of P-factor -N-P: Nitrogen starved in the absence of P-factor |