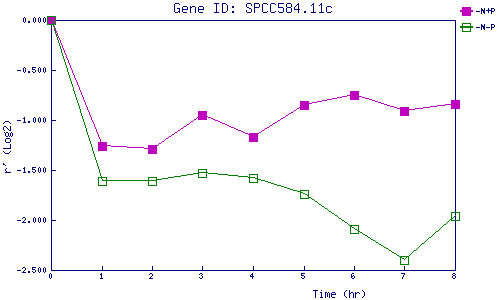
| 0 | 1 | 2 | 3 | 4 | 5 | 6 | 7 | 8 | |
| -N+P | 0.000 | -1.262 | -1.294 | -0.954 | -1.174 | -0.853 | -0.753 | -0.910 | -0.843 |
| -N-P | 0.000 | -1.607 | -1.614 | -1.533 | -1.578 | -1.742 | -2.091 | -2.404 | -1.961 |
|
-N+P: Nitrogen starved in the presence of P-factor -N-P: Nitrogen starved in the absence of P-factor |