| 0 | 1 | 2 | 3 | 4 | 5 | 6 | 7 | 8 | |
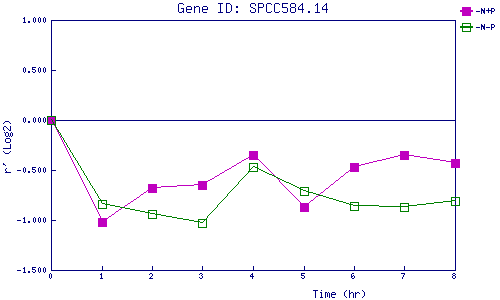
| -N+P | 0.000 | -1.018 | -0.685 | -0.649 | -0.350 | -0.871 | -0.472 | -0.351 | -0.426 |
| -N-P | 0.000 | -0.839 | -0.936 | -1.031 | -0.473 | -0.707 | -0.865 | -0.874 | -0.814 |
|
-N+P: Nitrogen starved in the presence of P-factor -N-P: Nitrogen starved in the absence of P-factor |