spp1
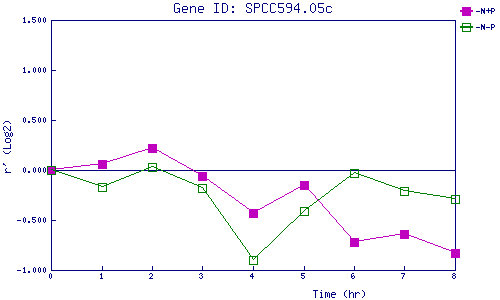
| 0 | 1 | 2 | 3 | 4 | 5 | 6 | 7 | 8 | |
| -N+P | 0.000 | 0.057 | 0.216 | -0.055 | -0.429 | -0.148 | -0.723 | -0.637 | -0.828 |
| -N-P | 0.000 | -0.170 | 0.034 | -0.185 | -0.899 | -0.409 | -0.033 | -0.208 | -0.287 |
|
-N+P: Nitrogen starved in the presence of P-factor -N-P: Nitrogen starved in the absence of P-factor |