taf72
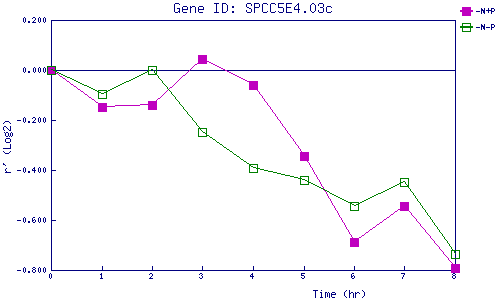
| 0 | 1 | 2 | 3 | 4 | 5 | 6 | 7 | 8 | |
| -N+P | 0.000 | -0.147 | -0.139 | 0.043 | -0.060 | -0.342 | -0.690 | -0.542 | -0.793 |
| -N-P | 0.000 | -0.096 | 0.002 | -0.248 | -0.394 | -0.438 | -0.542 | -0.446 | -0.735 |
|
-N+P: Nitrogen starved in the presence of P-factor -N-P: Nitrogen starved in the absence of P-factor |