rad18
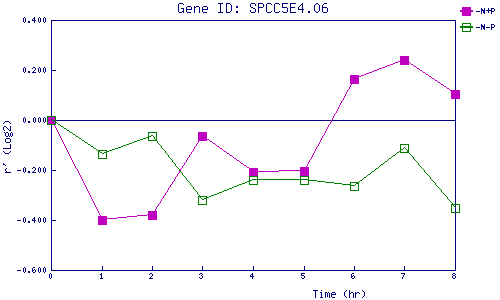
| 0 | 1 | 2 | 3 | 4 | 5 | 6 | 7 | 8 | |
| -N+P | 0.000 | -0.401 | -0.381 | -0.066 | -0.208 | -0.205 | 0.165 | 0.240 | 0.104 |
| -N-P | 0.000 | -0.135 | -0.064 | -0.320 | -0.241 | -0.238 | -0.263 | -0.111 | -0.350 |
|
-N+P: Nitrogen starved in the presence of P-factor -N-P: Nitrogen starved in the absence of P-factor |