rpl2802 rpl28-2
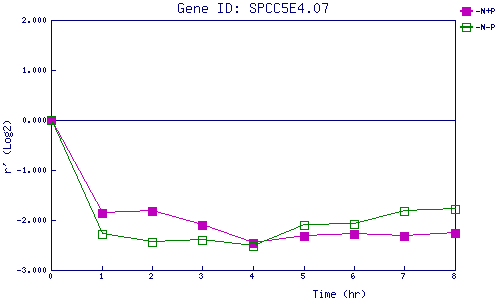
| 0 | 1 | 2 | 3 | 4 | 5 | 6 | 7 | 8 | |
| -N+P | 0.000 | -1.863 | -1.814 | -2.103 | -2.451 | -2.325 | -2.290 | -2.326 | -2.258 |
| -N-P | 0.000 | -2.283 | -2.448 | -2.390 | -2.511 | -2.107 | -2.083 | -1.826 | -1.785 |
|
-N+P: Nitrogen starved in the presence of P-factor -N-P: Nitrogen starved in the absence of P-factor |