| 0 | 1 | 2 | 3 | 4 | 5 | 6 | 7 | 8 | |
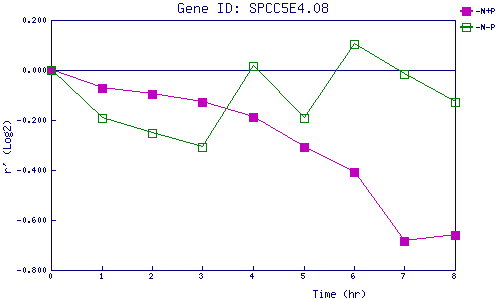
| -N+P | 0.000 | -0.074 | -0.094 | -0.129 | -0.189 | -0.307 | -0.410 | -0.685 | -0.660 |
| -N-P | 0.000 | -0.192 | -0.252 | -0.307 | 0.016 | -0.192 | 0.106 | -0.014 | -0.129 |
|
-N+P: Nitrogen starved in the presence of P-factor -N-P: Nitrogen starved in the absence of P-factor |