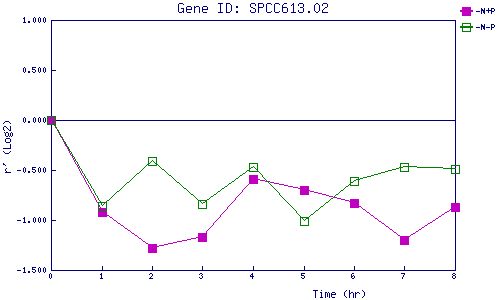
| 0 | 1 | 2 | 3 | 4 | 5 | 6 | 7 | 8 | |
| -N+P | 0.000 | -0.920 | -1.276 | -1.174 | -0.593 | -0.700 | -0.828 | -1.195 | -0.869 |
| -N-P | 0.000 | -0.862 | -0.408 | -0.838 | -0.472 | -1.015 | -0.614 | -0.471 | -0.487 |
|
-N+P: Nitrogen starved in the presence of P-factor -N-P: Nitrogen starved in the absence of P-factor |