| 0 | 1 | 2 | 3 | 4 | 5 | 6 | 7 | 8 | |
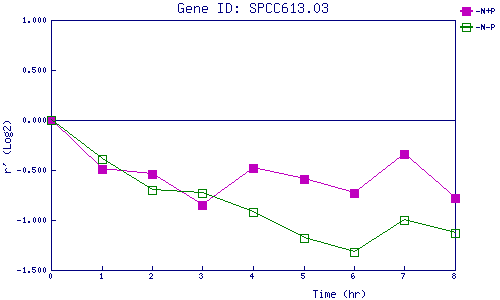
| -N+P | 0.000 | -0.486 | -0.537 | -0.847 | -0.477 | -0.592 | -0.733 | -0.339 | -0.775 |
| -N-P | 0.000 | -0.393 | -0.704 | -0.727 | -0.918 | -1.182 | -1.321 | -0.998 | -1.133 |
|
-N+P: Nitrogen starved in the presence of P-factor -N-P: Nitrogen starved in the absence of P-factor |