rng3
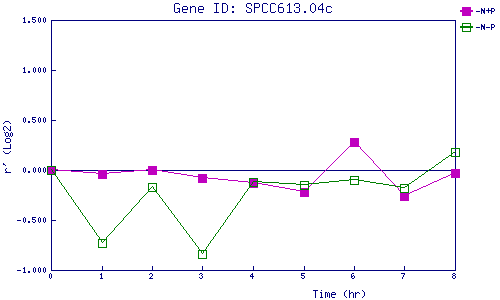
| 0 | 1 | 2 | 3 | 4 | 5 | 6 | 7 | 8 | |
| -N+P | 0.000 | -0.040 | -0.003 | -0.077 | -0.127 | -0.215 | 0.284 | -0.262 | -0.031 |
| -N-P | 0.000 | -0.729 | -0.169 | -0.841 | -0.120 | -0.149 | -0.103 | -0.180 | 0.184 |
|
-N+P: Nitrogen starved in the presence of P-factor -N-P: Nitrogen starved in the absence of P-factor |