rpl35
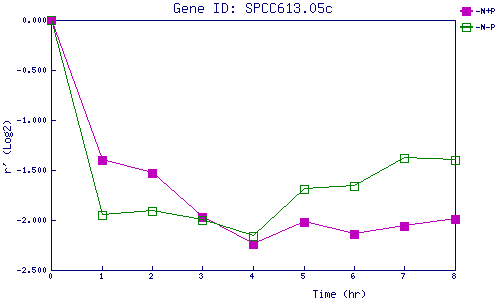
| 0 | 1 | 2 | 3 | 4 | 5 | 6 | 7 | 8 | |
| -N+P | 0.000 | -1.403 | -1.527 | -1.970 | -2.242 | -2.018 | -2.139 | -2.059 | -1.993 |
| -N-P | 0.000 | -1.947 | -1.907 | -2.000 | -2.165 | -1.691 | -1.656 | -1.383 | -1.400 |
|
-N+P: Nitrogen starved in the presence of P-factor -N-P: Nitrogen starved in the absence of P-factor |