rpl9-2 rpl902
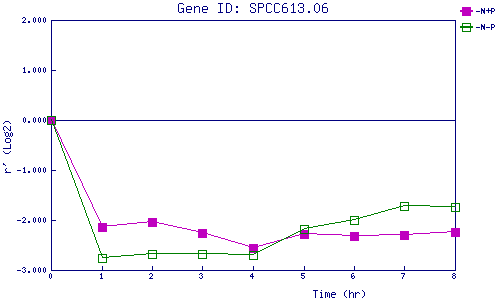
| 0 | 1 | 2 | 3 | 4 | 5 | 6 | 7 | 8 | |
| -N+P | 0.000 | -2.136 | -2.037 | -2.263 | -2.557 | -2.289 | -2.328 | -2.293 | -2.248 |
| -N-P | 0.000 | -2.770 | -2.687 | -2.679 | -2.700 | -2.175 | -1.998 | -1.713 | -1.735 |
|
-N+P: Nitrogen starved in the presence of P-factor -N-P: Nitrogen starved in the absence of P-factor |