| 0 | 1 | 2 | 3 | 4 | 5 | 6 | 7 | 8 | |
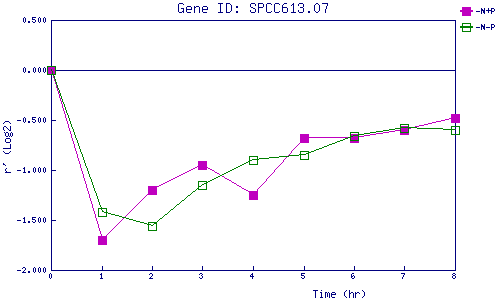
| -N+P | 0.000 | -1.705 | -1.198 | -0.946 | -1.248 | -0.675 | -0.678 | -0.599 | -0.482 |
| -N-P | 0.000 | -1.415 | -1.561 | -1.151 | -0.897 | -0.848 | -0.655 | -0.576 | -0.604 |
|
-N+P: Nitrogen starved in the presence of P-factor -N-P: Nitrogen starved in the absence of P-factor |