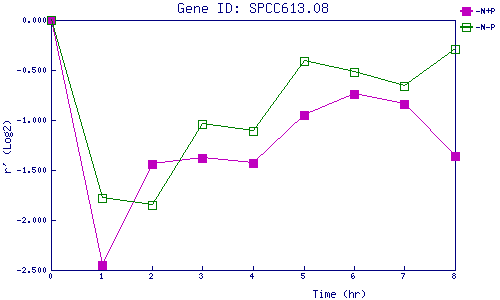
| 0 | 1 | 2 | 3 | 4 | 5 | 6 | 7 | 8 | |
| -N+P | 0.000 | -2.450 | -1.436 | -1.385 | -1.427 | -0.954 | -0.739 | -0.839 | -1.356 |
| -N-P | 0.000 | -1.779 | -1.847 | -1.043 | -1.113 | -0.409 | -0.521 | -0.665 | -0.291 |
|
-N+P: Nitrogen starved in the presence of P-factor -N-P: Nitrogen starved in the absence of P-factor |