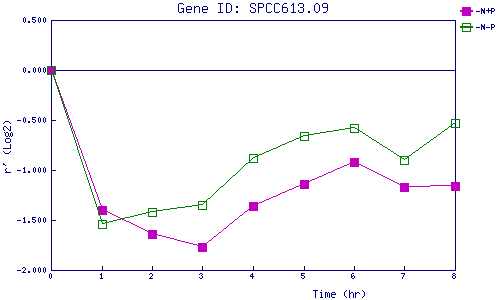
| 0 | 1 | 2 | 3 | 4 | 5 | 6 | 7 | 8 | |
| -N+P | 0.000 | -1.395 | -1.643 | -1.774 | -1.356 | -1.142 | -0.915 | -1.166 | -1.155 |
| -N-P | 0.000 | -1.535 | -1.424 | -1.352 | -0.881 | -0.657 | -0.578 | -0.903 | -0.527 |
|
-N+P: Nitrogen starved in the presence of P-factor -N-P: Nitrogen starved in the absence of P-factor |