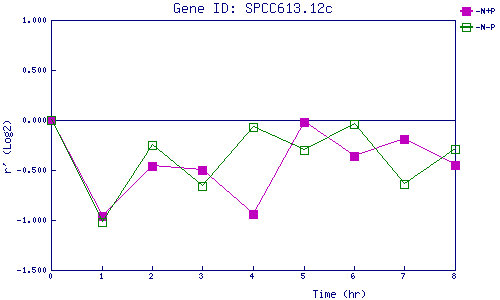
| 0 | 1 | 2 | 3 | 4 | 5 | 6 | 7 | 8 | |
| -N+P | 0.000 | -0.965 | -0.459 | -0.505 | -0.940 | -0.024 | -0.361 | -0.188 | -0.452 |
| -N-P | 0.000 | -1.024 | -0.247 | -0.659 | -0.073 | -0.302 | -0.035 | -0.639 | -0.288 |
|
-N+P: Nitrogen starved in the presence of P-factor -N-P: Nitrogen starved in the absence of P-factor |