rhp16 rad16
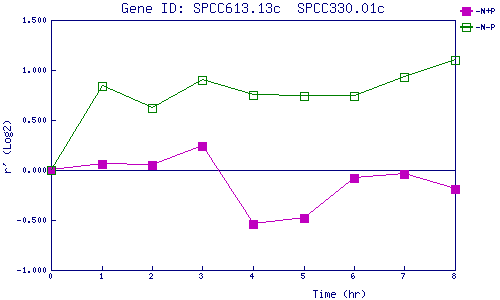
| 0 | 1 | 2 | 3 | 4 | 5 | 6 | 7 | 8 | |
| -N+P | 0.000 | 0.060 | 0.047 | 0.242 | -0.542 | -0.481 | -0.075 | -0.039 | -0.193 |
| -N-P | 0.000 | 0.839 | 0.617 | 0.895 | 0.752 | 0.736 | 0.735 | 0.934 | 1.104 |
|
-N+P: Nitrogen starved in the presence of P-factor -N-P: Nitrogen starved in the absence of P-factor |