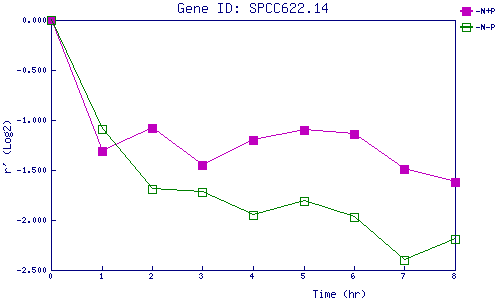
| 0 | 1 | 2 | 3 | 4 | 5 | 6 | 7 | 8 | |
| -N+P | 0.000 | -1.306 | -1.082 | -1.448 | -1.199 | -1.100 | -1.137 | -1.490 | -1.620 |
| -N-P | 0.000 | -1.088 | -1.695 | -1.719 | -1.954 | -1.808 | -1.974 | -2.401 | -2.189 |
|
-N+P: Nitrogen starved in the presence of P-factor -N-P: Nitrogen starved in the absence of P-factor |