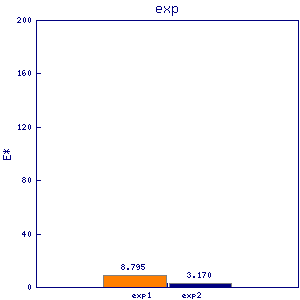
epe1
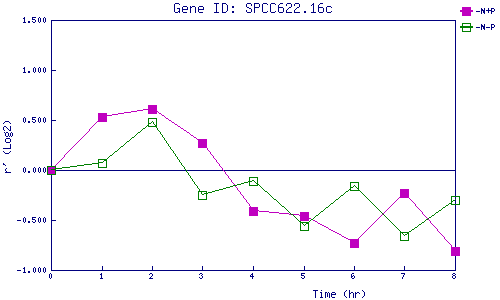
| 0 | 1 | 2 | 3 | 4 | 5 | 6 | 7 | 8 | |
| -N+P | 0.000 | 0.534 | 0.608 | 0.273 | -0.407 | -0.462 | -0.728 | -0.226 | -0.814 |
| -N-P | 0.000 | 0.073 | 0.485 | -0.252 | -0.112 | -0.565 | -0.161 | -0.657 | -0.303 |
|
-N+P: Nitrogen starved in the presence of P-factor -N-P: Nitrogen starved in the absence of P-factor |