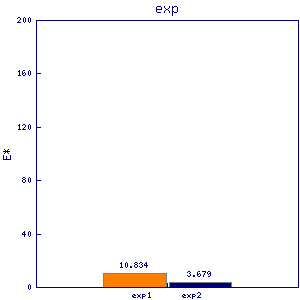
apn1
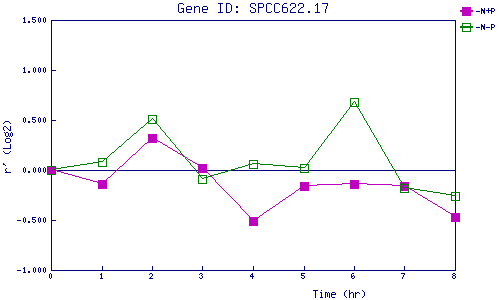
| 0 | 1 | 2 | 3 | 4 | 5 | 6 | 7 | 8 | |
| -N+P | 0.000 | -0.135 | 0.322 | 0.025 | -0.514 | -0.157 | -0.139 | -0.161 | -0.471 |
| -N-P | 0.000 | 0.076 | 0.512 | -0.090 | 0.065 | 0.025 | 0.678 | -0.182 | -0.261 |
|
-N+P: Nitrogen starved in the presence of P-factor -N-P: Nitrogen starved in the absence of P-factor |