rpl6
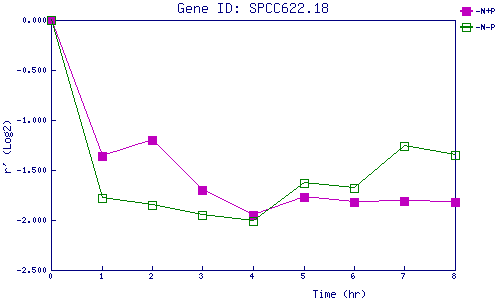
| 0 | 1 | 2 | 3 | 4 | 5 | 6 | 7 | 8 | |
| -N+P | 0.000 | -1.355 | -1.199 | -1.700 | -1.952 | -1.773 | -1.818 | -1.812 | -1.818 |
| -N-P | 0.000 | -1.775 | -1.852 | -1.949 | -2.007 | -1.634 | -1.680 | -1.259 | -1.347 |
|
-N+P: Nitrogen starved in the presence of P-factor -N-P: Nitrogen starved in the absence of P-factor |