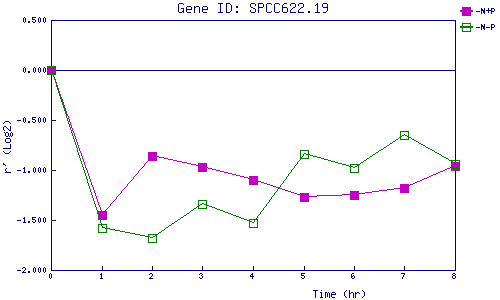
| 0 | 1 | 2 | 3 | 4 | 5 | 6 | 7 | 8 | |
| -N+P | 0.000 | -1.447 | -0.856 | -0.971 | -1.097 | -1.273 | -1.251 | -1.178 | -0.963 |
| -N-P | 0.000 | -1.585 | -1.675 | -1.340 | -1.527 | -0.845 | -0.982 | -0.647 | -0.944 |
|
-N+P: Nitrogen starved in the presence of P-factor -N-P: Nitrogen starved in the absence of P-factor |