| 0 | 1 | 2 | 3 | 4 | 5 | 6 | 7 | 8 | |
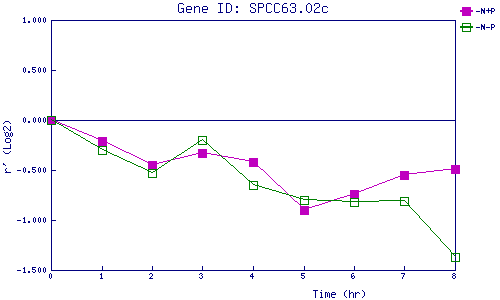
| -N+P | 0.000 | -0.210 | -0.448 | -0.326 | -0.420 | -0.899 | -0.737 | -0.549 | -0.489 |
| -N-P | 0.000 | -0.301 | -0.527 | -0.198 | -0.648 | -0.798 | -0.819 | -0.808 | -1.372 |
|
-N+P: Nitrogen starved in the presence of P-factor -N-P: Nitrogen starved in the absence of P-factor |