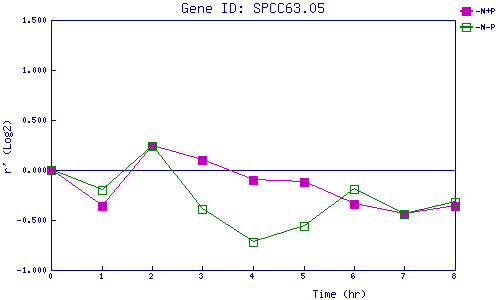
| 0 | 1 | 2 | 3 | 4 | 5 | 6 | 7 | 8 | |
| -N+P | 0.000 | -0.356 | 0.243 | 0.103 | -0.102 | -0.124 | -0.342 | -0.438 | -0.357 |
| -N-P | 0.000 | -0.196 | 0.235 | -0.388 | -0.719 | -0.556 | -0.191 | -0.443 | -0.320 |
|
-N+P: Nitrogen starved in the presence of P-factor -N-P: Nitrogen starved in the absence of P-factor |