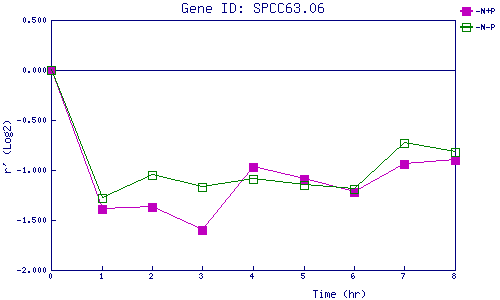
| 0 | 1 | 2 | 3 | 4 | 5 | 6 | 7 | 8 | |
| -N+P | 0.000 | -1.387 | -1.371 | -1.604 | -0.967 | -1.088 | -1.218 | -0.938 | -0.904 |
| -N-P | 0.000 | -1.279 | -1.052 | -1.172 | -1.087 | -1.147 | -1.188 | -0.731 | -0.825 |
|
-N+P: Nitrogen starved in the presence of P-factor -N-P: Nitrogen starved in the absence of P-factor |