| 0 | 1 | 2 | 3 | 4 | 5 | 6 | 7 | 8 | |
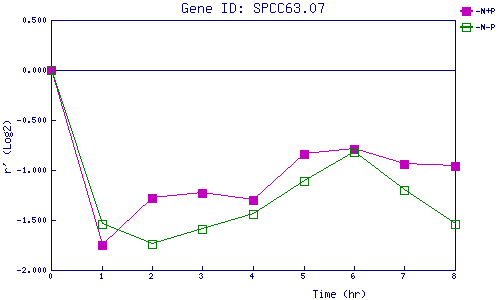
| -N+P | 0.000 | -1.749 | -1.281 | -1.228 | -1.301 | -0.836 | -0.794 | -0.939 | -0.961 |
| -N-P | 0.000 | -1.545 | -1.737 | -1.590 | -1.435 | -1.111 | -0.823 | -1.200 | -1.537 |
|
-N+P: Nitrogen starved in the presence of P-factor -N-P: Nitrogen starved in the absence of P-factor |