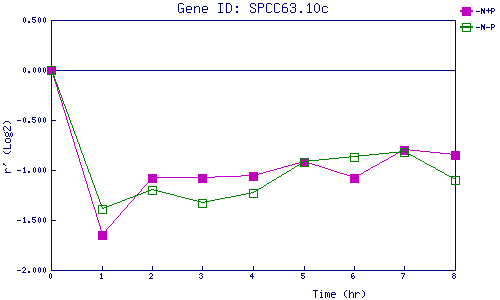
| 0 | 1 | 2 | 3 | 4 | 5 | 6 | 7 | 8 | |
| -N+P | 0.000 | -1.649 | -1.078 | -1.076 | -1.059 | -0.916 | -1.079 | -0.796 | -0.848 |
| -N-P | 0.000 | -1.387 | -1.199 | -1.331 | -1.233 | -0.918 | -0.873 | -0.821 | -1.101 |
|
-N+P: Nitrogen starved in the presence of P-factor -N-P: Nitrogen starved in the absence of P-factor |