prp28
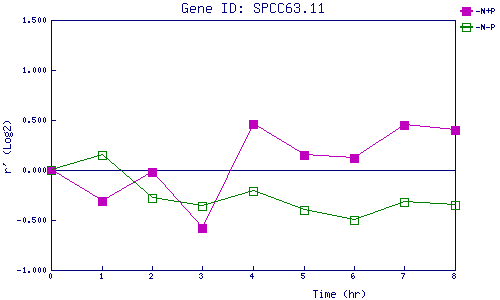
| 0 | 1 | 2 | 3 | 4 | 5 | 6 | 7 | 8 | |
| -N+P | 0.000 | -0.311 | -0.022 | -0.582 | 0.465 | 0.150 | 0.119 | 0.450 | 0.398 |
| -N-P | 0.000 | 0.153 | -0.281 | -0.360 | -0.210 | -0.402 | -0.495 | -0.325 | -0.353 |
|
-N+P: Nitrogen starved in the presence of P-factor -N-P: Nitrogen starved in the absence of P-factor |