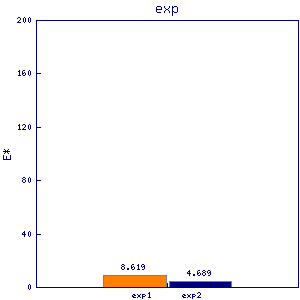
cig1
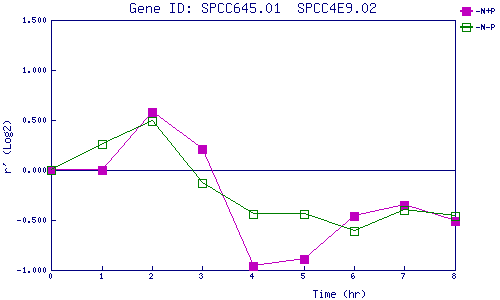
| 0 | 1 | 2 | 3 | 4 | 5 | 6 | 7 | 8 | |
| -N+P | 0.000 | -0.005 | 0.578 | 0.206 | -0.955 | -0.889 | -0.464 | -0.352 | -0.510 |
| -N-P | 0.000 | 0.259 | 0.491 | -0.127 | -0.439 | -0.435 | -0.614 | -0.402 | -0.463 |
|
-N+P: Nitrogen starved in the presence of P-factor -N-P: Nitrogen starved in the absence of P-factor |