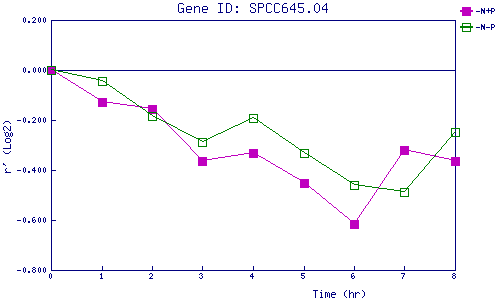
| 0 | 1 | 2 | 3 | 4 | 5 | 6 | 7 | 8 | |
| -N+P | 0.000 | -0.127 | -0.156 | -0.363 | -0.333 | -0.453 | -0.615 | -0.322 | -0.363 |
| -N-P | 0.000 | -0.045 | -0.185 | -0.290 | -0.194 | -0.333 | -0.460 | -0.489 | -0.249 |
|
-N+P: Nitrogen starved in the presence of P-factor -N-P: Nitrogen starved in the absence of P-factor |