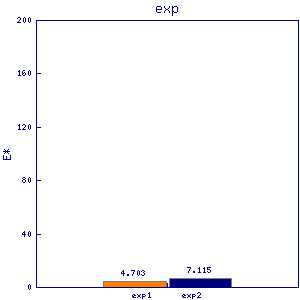
myo2
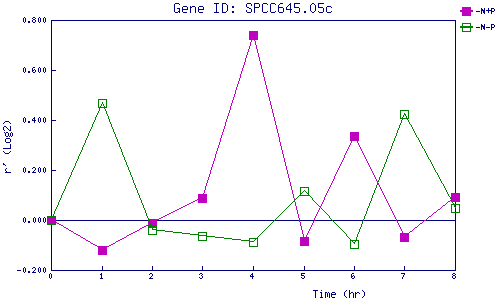
| 0 | 1 | 2 | 3 | 4 | 5 | 6 | 7 | 8 | |
| -N+P | 0.000 | -0.119 | -0.011 | 0.090 | 0.740 | -0.085 | 0.337 | -0.069 | 0.093 |
| -N-P | 0.000 | 0.467 | -0.039 | -0.063 | -0.089 | 0.116 | -0.097 | 0.422 | 0.048 |
|
-N+P: Nitrogen starved in the presence of P-factor -N-P: Nitrogen starved in the absence of P-factor |