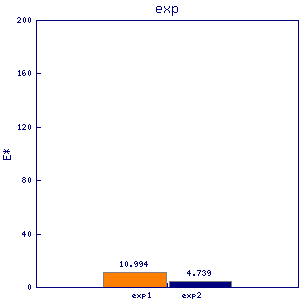
rgf1
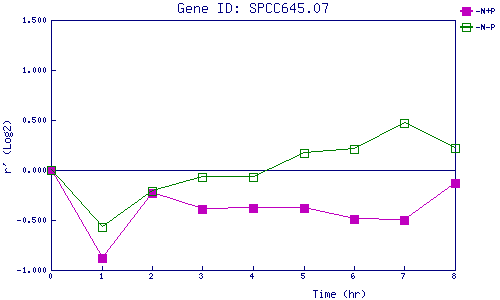
| 0 | 1 | 2 | 3 | 4 | 5 | 6 | 7 | 8 | |
| -N+P | 0.000 | -0.879 | -0.229 | -0.394 | -0.382 | -0.382 | -0.490 | -0.495 | -0.133 |
| -N-P | 0.000 | -0.568 | -0.210 | -0.069 | -0.073 | 0.171 | 0.210 | 0.470 | 0.215 |
|
-N+P: Nitrogen starved in the presence of P-factor -N-P: Nitrogen starved in the absence of P-factor |