| 0 | 1 | 2 | 3 | 4 | 5 | 6 | 7 | 8 | |
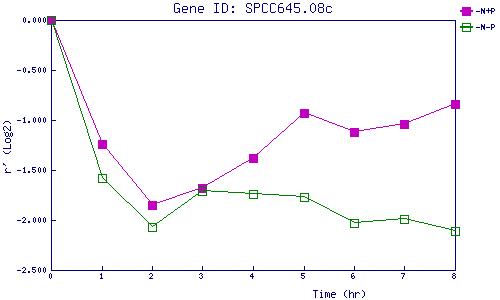
| -N+P | 0.000 | -1.239 | -1.848 | -1.681 | -1.382 | -0.926 | -1.119 | -1.039 | -0.841 |
| -N-P | 0.000 | -1.584 | -2.070 | -1.708 | -1.742 | -1.769 | -2.027 | -1.992 | -2.114 |
|
-N+P: Nitrogen starved in the presence of P-factor -N-P: Nitrogen starved in the absence of P-factor |