| 0 | 1 | 2 | 3 | 4 | 5 | 6 | 7 | 8 | |
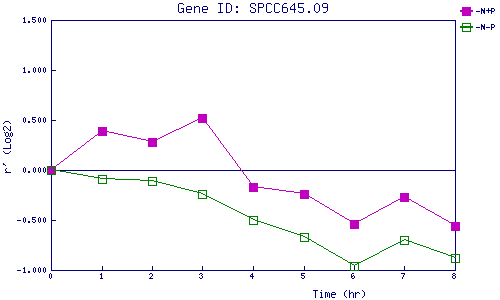
| -N+P | 0.000 | 0.391 | 0.279 | 0.518 | -0.169 | -0.244 | -0.541 | -0.274 | -0.565 |
| -N-P | 0.000 | -0.086 | -0.110 | -0.235 | -0.495 | -0.672 | -0.958 | -0.699 | -0.879 |
|
-N+P: Nitrogen starved in the presence of P-factor -N-P: Nitrogen starved in the absence of P-factor |