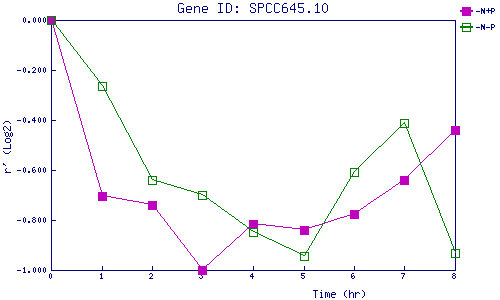
| 0 | 1 | 2 | 3 | 4 | 5 | 6 | 7 | 8 | |
| -N+P | 0.000 | -0.704 | -0.740 | -1.000 | -0.818 | -0.839 | -0.774 | -0.640 | -0.442 |
| -N-P | 0.000 | -0.266 | -0.642 | -0.701 | -0.846 | -0.943 | -0.610 | -0.413 | -0.932 |
|
-N+P: Nitrogen starved in the presence of P-factor -N-P: Nitrogen starved in the absence of P-factor |